Housing Market

San Francisco Housing Price Chart San Francisco Housing Price Chart

San Francisco Housing Price Chart

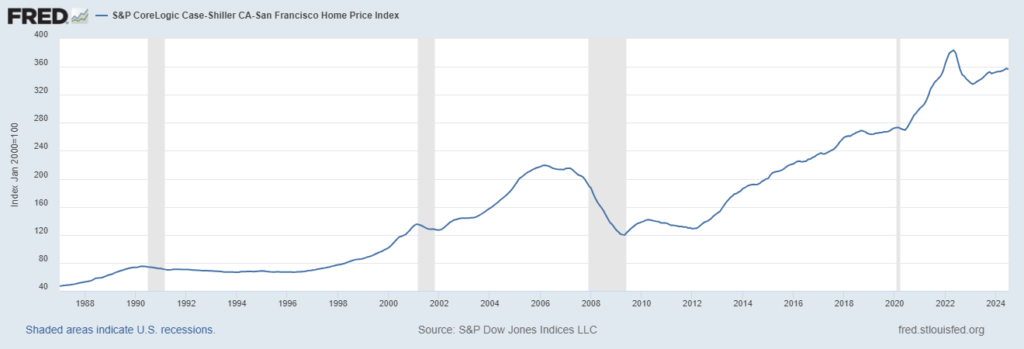
Do you want to know the real story behind Housing Prices in San Francisco? Let’s delve into the data and explore the ups and downs of this famous and expensive market. The San Francisco Housing Price Chart reveals a complex picture, much more than simply rising costs. San Francisco Housing Price Chart Source: FRED The San Francisco real estate market is notoriously challenging. Limited space, high demand and strict building regulations contribute to the high prices. It’s not just about buying a house; It also affects renters, creating a constant struggle for affordable living. The data we will see comes from S&P CoreLogic Case-Shiller CA-San Francisco Home Price Index, a reliable source that tracks changes in home prices over time. It is essential to use reliable data to understand this complex situation. The S&P CoreLogic Case-Shiller Index The S&P CoreLogic Case-Shiller Index gives us a clear idea of ​​how House Prices in San Francisco have changed since 1987. The index uses January 2000 as a base of 100, so you can easily see the percentage increase or decrease from that point. The data is seasonally adjusted meaning it eliminates normal seasonal fluctuations (like higher sales in the spring) to give us a clearer trend. I have personally analyzed this data for years. Believe me, if you want to buy or sell a house here,  you need to understand what all those numbers mean. It’s not enough to look at the numbers; you must understand what they are really telling you. Key Periods in the San Francisco House Price Chart Let’s break down some significant periods reflected in the San Francisco Housing Price Chart: 1980s and 1990s: A period of relatively stable and constant growth. While House Prices in San Francisco were already high, the increases were not as dramatic as those we would see later. The dotcom boom (late 90s and early 2000s): The explosive growth of the technology industry dramatically increased Housing Prices in San Francisco. This era saw a significant upward swing in the index, reflecting the influx of wealthy tech workers. The housing bubble and bust (2000s): Like many areas, San Francisco experienced a housing bubble, which caused extreme price increases followed by a sharp correction during the 2008 financial crisis. The index shows a notable decline during this period. Many lost significant amounts in their homes. The post-recession recovery and beyond (2010s to present): After the Financial Crisis, Housing Prices in San Francisco bounced hard. The technology boom continued and limited housing supply continued to drive prices higher. The last decade shows continued growth, although at a slower pace than the peak years. Data Table: S&P CoreLogic Case-Shiller CA-San Francisco Home Price Index (select years) Year Index value (January 2000 = 100) 1987 46.96 1997 69.64 2000 101.45 2007 214.62 2008 186.63 2012 128.64 2017 235.26 2022 364.61 2023 336.92 2024 356.29 (Note: This table shows years selected for brevity. complete data set contains monthly values ​​from 1987 to 2024.) Factors influencing housing prices in San Francisco Many factors play a crucial role in shaping the House Prices in San Francisco: Limited housing offer: San Francisco has a geographically restricted area, which limits the potential for new construction. Strict zoning laws and lengthy permitting processes further restrict construction. High demand: The city’s attractiveness as a place to live and work contributes to sustained high demand for housing. This demand comes from both local residents and those moving from other areas. Economic growth: The city’s strong economy, particularly its technology industry, significantly affects housing affordability. High-paying jobs attract people who can afford to pay high prices. Interest rates: Interest rates influence how many people can afford to buy a home. Low interest rates tend to drive up prices. High interest rates can reduce demand and moderate price increases. Government regulations: Local regulations on housing development and construction play an important role in shaping the real estate market. Regulations aimed at preserving the city’s character can make it difficult to increase supply. Personal observations Based on years of tracking the San Francisco real estate market, I can offer a personal perspective. While the recent slight drop may seem like a significant change, it is crucial to keep the bigger picture in mind. Housing prices in San Francisco remain significantly higher than they were a decade ago. We can see the influence of economic cycles in the data, with periods of rapid growth followed by corrections. However, underlying factors (limited supply and high demand) continue to put upward pressure on prices. My expectation is that, despite fluctuations, we will see continued pressure to increase prices over the long term unless there are significant changes to the city’s planning and development policies. The future of housing prices in San Francisco Predicting the future of Home Prices in San Francisco is a challenging task, even for seasoned professionals. The city faces complex issues that will continue to impact the market. While the current level of price growth is likely to slow in the coming years unless building regulations are relaxed and more homes are built, there will still be high demand for real estate, so the prices will likely remain very high. Related articles: House price graph over the last 20 years USA 50 Year Real Estate Market Chart – Shows Price Growth San Diego real estate market graph 50 years: analysis and trends California real estate market graph 50 years Average house prices per year in the United States Average increase in home value per year, 5 years, 10 years How much did house prices fall in 2008? 2008 Real Estate Crash Explained: Causes and Effects The publication San Francisco Housing Price Chart appeared first on Norada Real Estate Investments.

San Francisco Housing Price Chart Read More »

Where are the investors Think Realty Where are the investors? | Think Realty

Where are the investors? | Think Realty

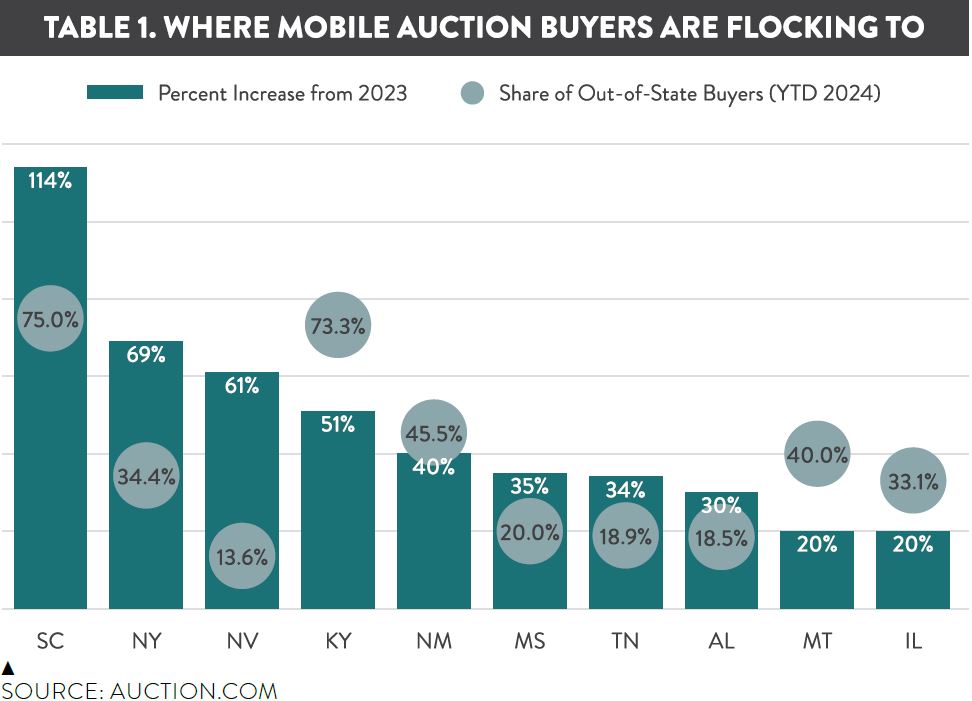
Changes are afoot in the real estate market in 2024 as investors flock to emerging hot spots and retreat from traditional strongholds. The housing market has always been local, and 2024 housing market trends are proving that with substantial market variation in retail inventory, home price appreciation, and even the onset of foreclosures. These retail trends, in turn, are driving interest from local community developers who buy on Auction.com. “Chattanooga has just been flooded with investors from California and elsewhere … there are no properties that can be bought and paid for there,” said Steve Johnson, an Auction.com buyer who lives in Chattanooga but decided to start buying properties across the border in Georgia when Chattanooga became out of reach due to prices. “These smaller, less urban counties and cities are gold mines for finding properties that are overlooked by big investors and resellers. But there are a huge number of people looking for a home.” Sue McCormick, an Atlanta-based buyer for Auction.com, told a similar story. “I wanted to start investing, but Atlanta is a little expensive,” said McCormick, who decided to start investing in Dayton, Ohio, where he grew up. “I started investing in my hometown because it was easier to get into.” Tendering activity as a barometer of the retail market The buying and bidding activity of investors like McCormick and Johnson acts as a reliable barometer of the strength of the local retail market. Specifically, the proportion of buyers in each market who purchase outside their home market provides insight into which markets are most attractive (and least attractive) to buyers willing and able to invest outside their home market. These geographically flexible buyers are more likely to target markets based on the underlying strength and opportunity in those markets rather than the convenience and comfort that comes with shopping in their own backyard. Doing good by doing good Still, many of these geographically flexible buyers are emotionally connected to the market or markets in which they choose to invest. “My real passion is going back to the neighborhoods I grew up in and helping improve those areas and making money,” said McCormick, who continues to hold down a regular “day” job even as he invests. Johnson grew up in Georgia and traveled there frequently for work before retiring several years ago. Helping people buy a home they can afford — something his family was never able to do when he was growing up — is a value close to his heart. “That’s my market because you’re helping people who don’t have options, and secondly, you don’t have a lot of competition,” he said. “Those stories (of helping people) are just as important as making a profit.” I'm not rich enough to afford to lose money, but if you do the right thing, you'll have everything you need. Technology-enabled investor mobility Technology has allowed even smaller-volume investors like McCormick and Johnson to invest outside their own homes. All bank-owned REO auctions offered on platforms like Auction.com are online, and investors can buy remotely at foreclosure auctions in an increasing number of markets. The growing opportunity to bid remotely at foreclosure auctions is due to two key developments in recent years. First, changes in state laws have allowed online bidding in some states. Ohio, where McCormick invests, is one example. Second, Auction.com has continued to expand Remote Bid, a technology launched in 2020 that is now available in more than 1,000 counties across the country. “The difference between remote auction and online auction is that you don’t have to drive or sit in the courthouse,” Johnson said. “With remote auction, I can buy from anywhere.” States that attract more mobile investors During the first half of 2024, the states that attracted the largest share of out-of-state buyers on Auction.com were South Carolina (75%), Kentucky (73%), West Virginia (73%), Maryland (56%), and Pennsylvania (48%). However, the absolute share of out-of-state buyers does not reflect the full reality, as some states are inherently more conducive to out-of-state buyers when there are major metropolitan areas straddling state lines. The best measure is the change in the share of out-of-state buyers so far in 2024 compared to 2023 (see Figure 1). The states with the largest percentage increase in out-of-state buyers were South Carolina (up 114%), North Carolina (up 69%), Nevada (up 61%), Kentucky (up 51%) and New Mexico (up 40%). Other states in the top 10 for the largest increase in out-of-state buyer participation include Mississippi (up 35%), Tennessee (up 34%), Alabama (up 30%), Montana (up 20%) and Illinois (up 20%). Georgia, where Johnson invests, was No. 11 on the list with an 18% increase. States with a decreasing share of mobile investors At the other end of the spectrum are states with a declining share of out-of-state buyers, an indication that geographically flexible buyers more focused on market strength and opportunity are moving away from those states (see Figure 2). The states with the largest percentage decrease in out-of-state buyers so far in 2024 compared to 2023 were Washington (down 62%), New Jersey (down 51%), Michigan (down 48%), California (down 46%) and Idaho (down 40%).Other states in the top 10 with the largest declines in the share of out-of-state buyers were Virginia (down 40%), Indiana (down 35%), Arizona (down 35%), Ohio (down 31%) and Iowa (down 27%). The states with the lowest share of out-of-state buyers so far in 2024 (typically markets that have not been attractive to geographically flexible buyers for several years) were California (2% of out-of-state buyers so far in 2024), Washington (3%), New York (8%), New Jersey (10%), and Idaho (10%). Top 25 County Trends County-level data provides an even more precise view of which local markets are most and least attractive to geographically flexible real estate investors. At the county level, it is beneficial to look at the share of buyers who live outside the county, not out of state. Those buyers still typically represent geographically flexible investors, given that the average U.S.

Where are the investors? | Think Realty Read More »